

Total attendees
0
↑ 18.6% vs last event
Turn live event data into faster answers and smarter decisions with fielddrive Insights. Track onsite activity, review event reports, explore post-event analytics, and get instant answers to your event queries.


From real-time tracking and live dashboards to post-event analytics, ROI analysis, and AI-powered answers, fielddrive Insights helps teams make smarter decisions before, during, and after the event.
.svg)


.svg)
Track check-ins, badge printing, access control, and lead retrieval.
View live check-ins, session scans, lead activity, and attendee flow.
Get quick answers from live data without digging through reports.
Access daily reports, live dashboards, and post-event summaries.
Use real data to improve staffing, capacity, content, and resources.
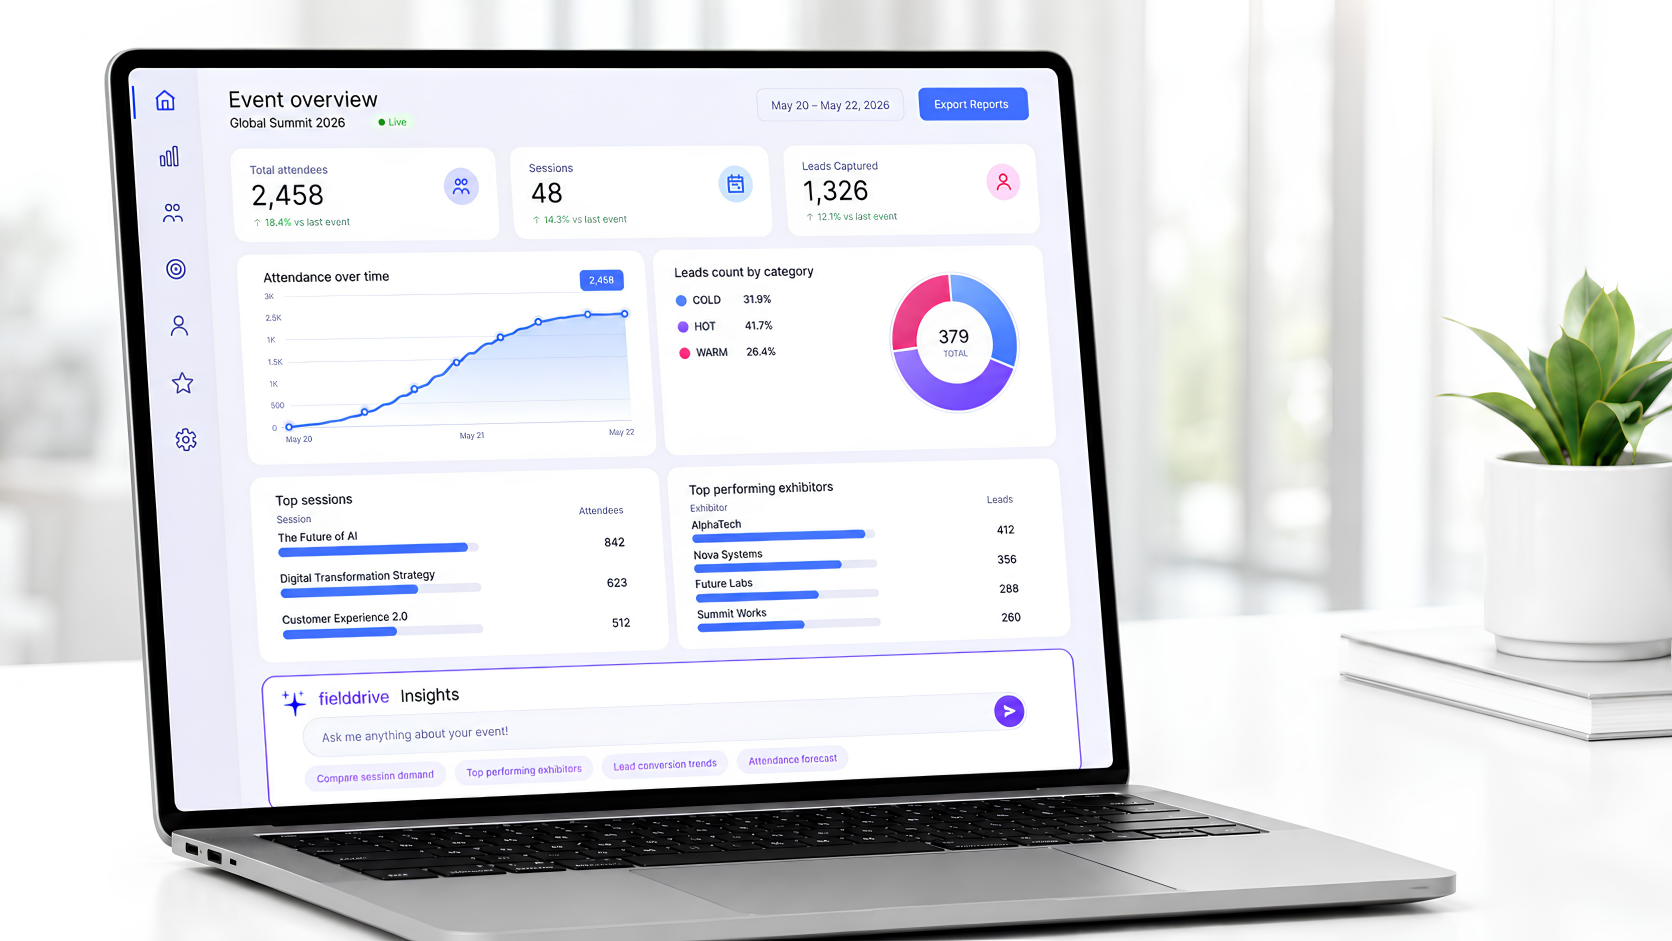
Ask questions in everyday language and get clear answers across event planning, onsite tracking, post-event performance, and ROI.
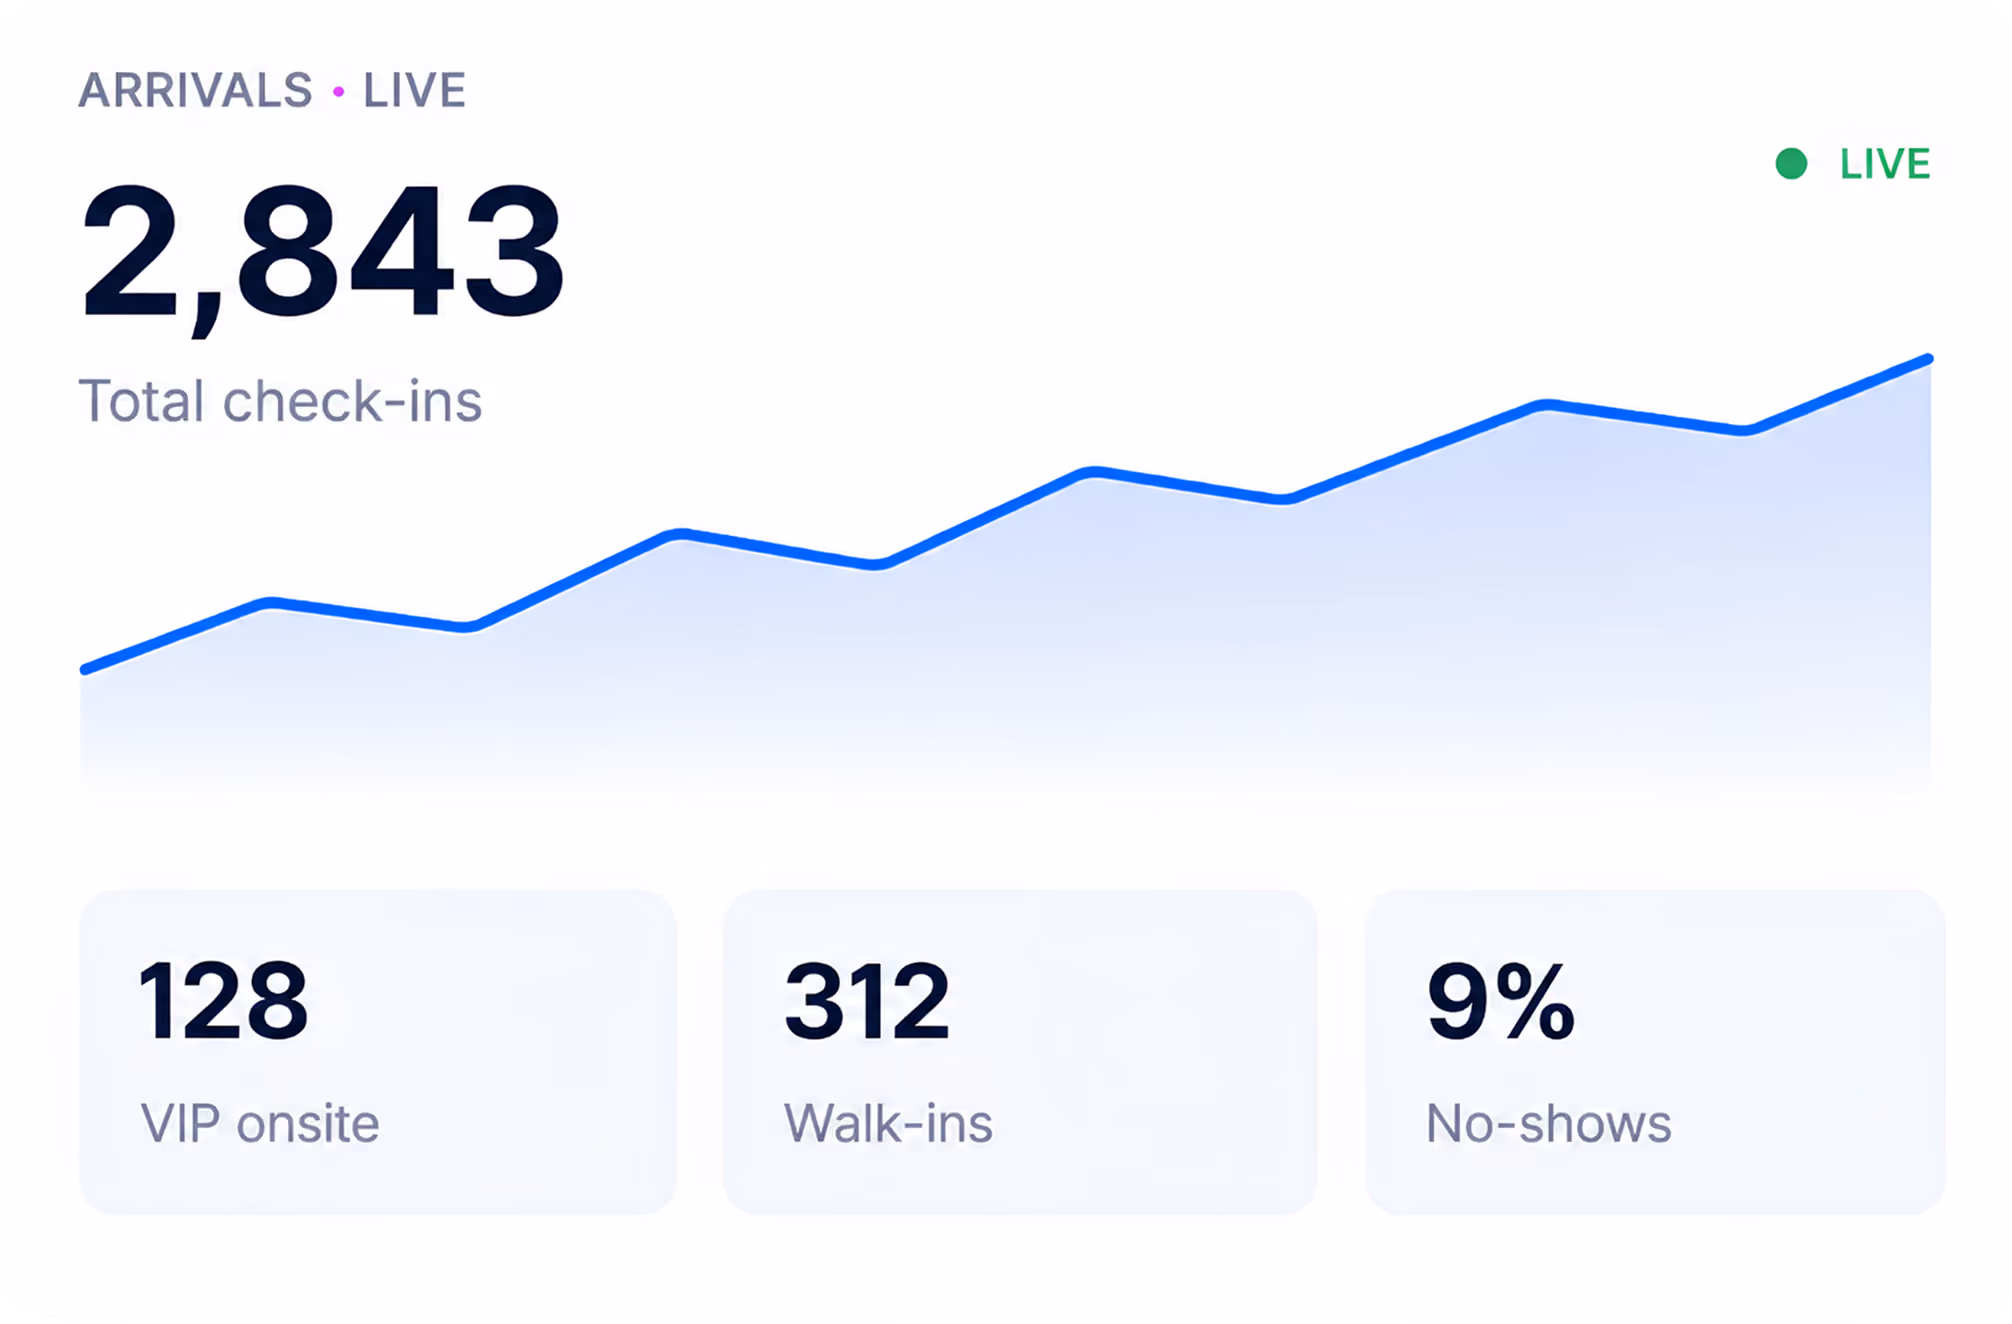
See what is happening across your event as it unfolds, from arrival flow to session attendance.
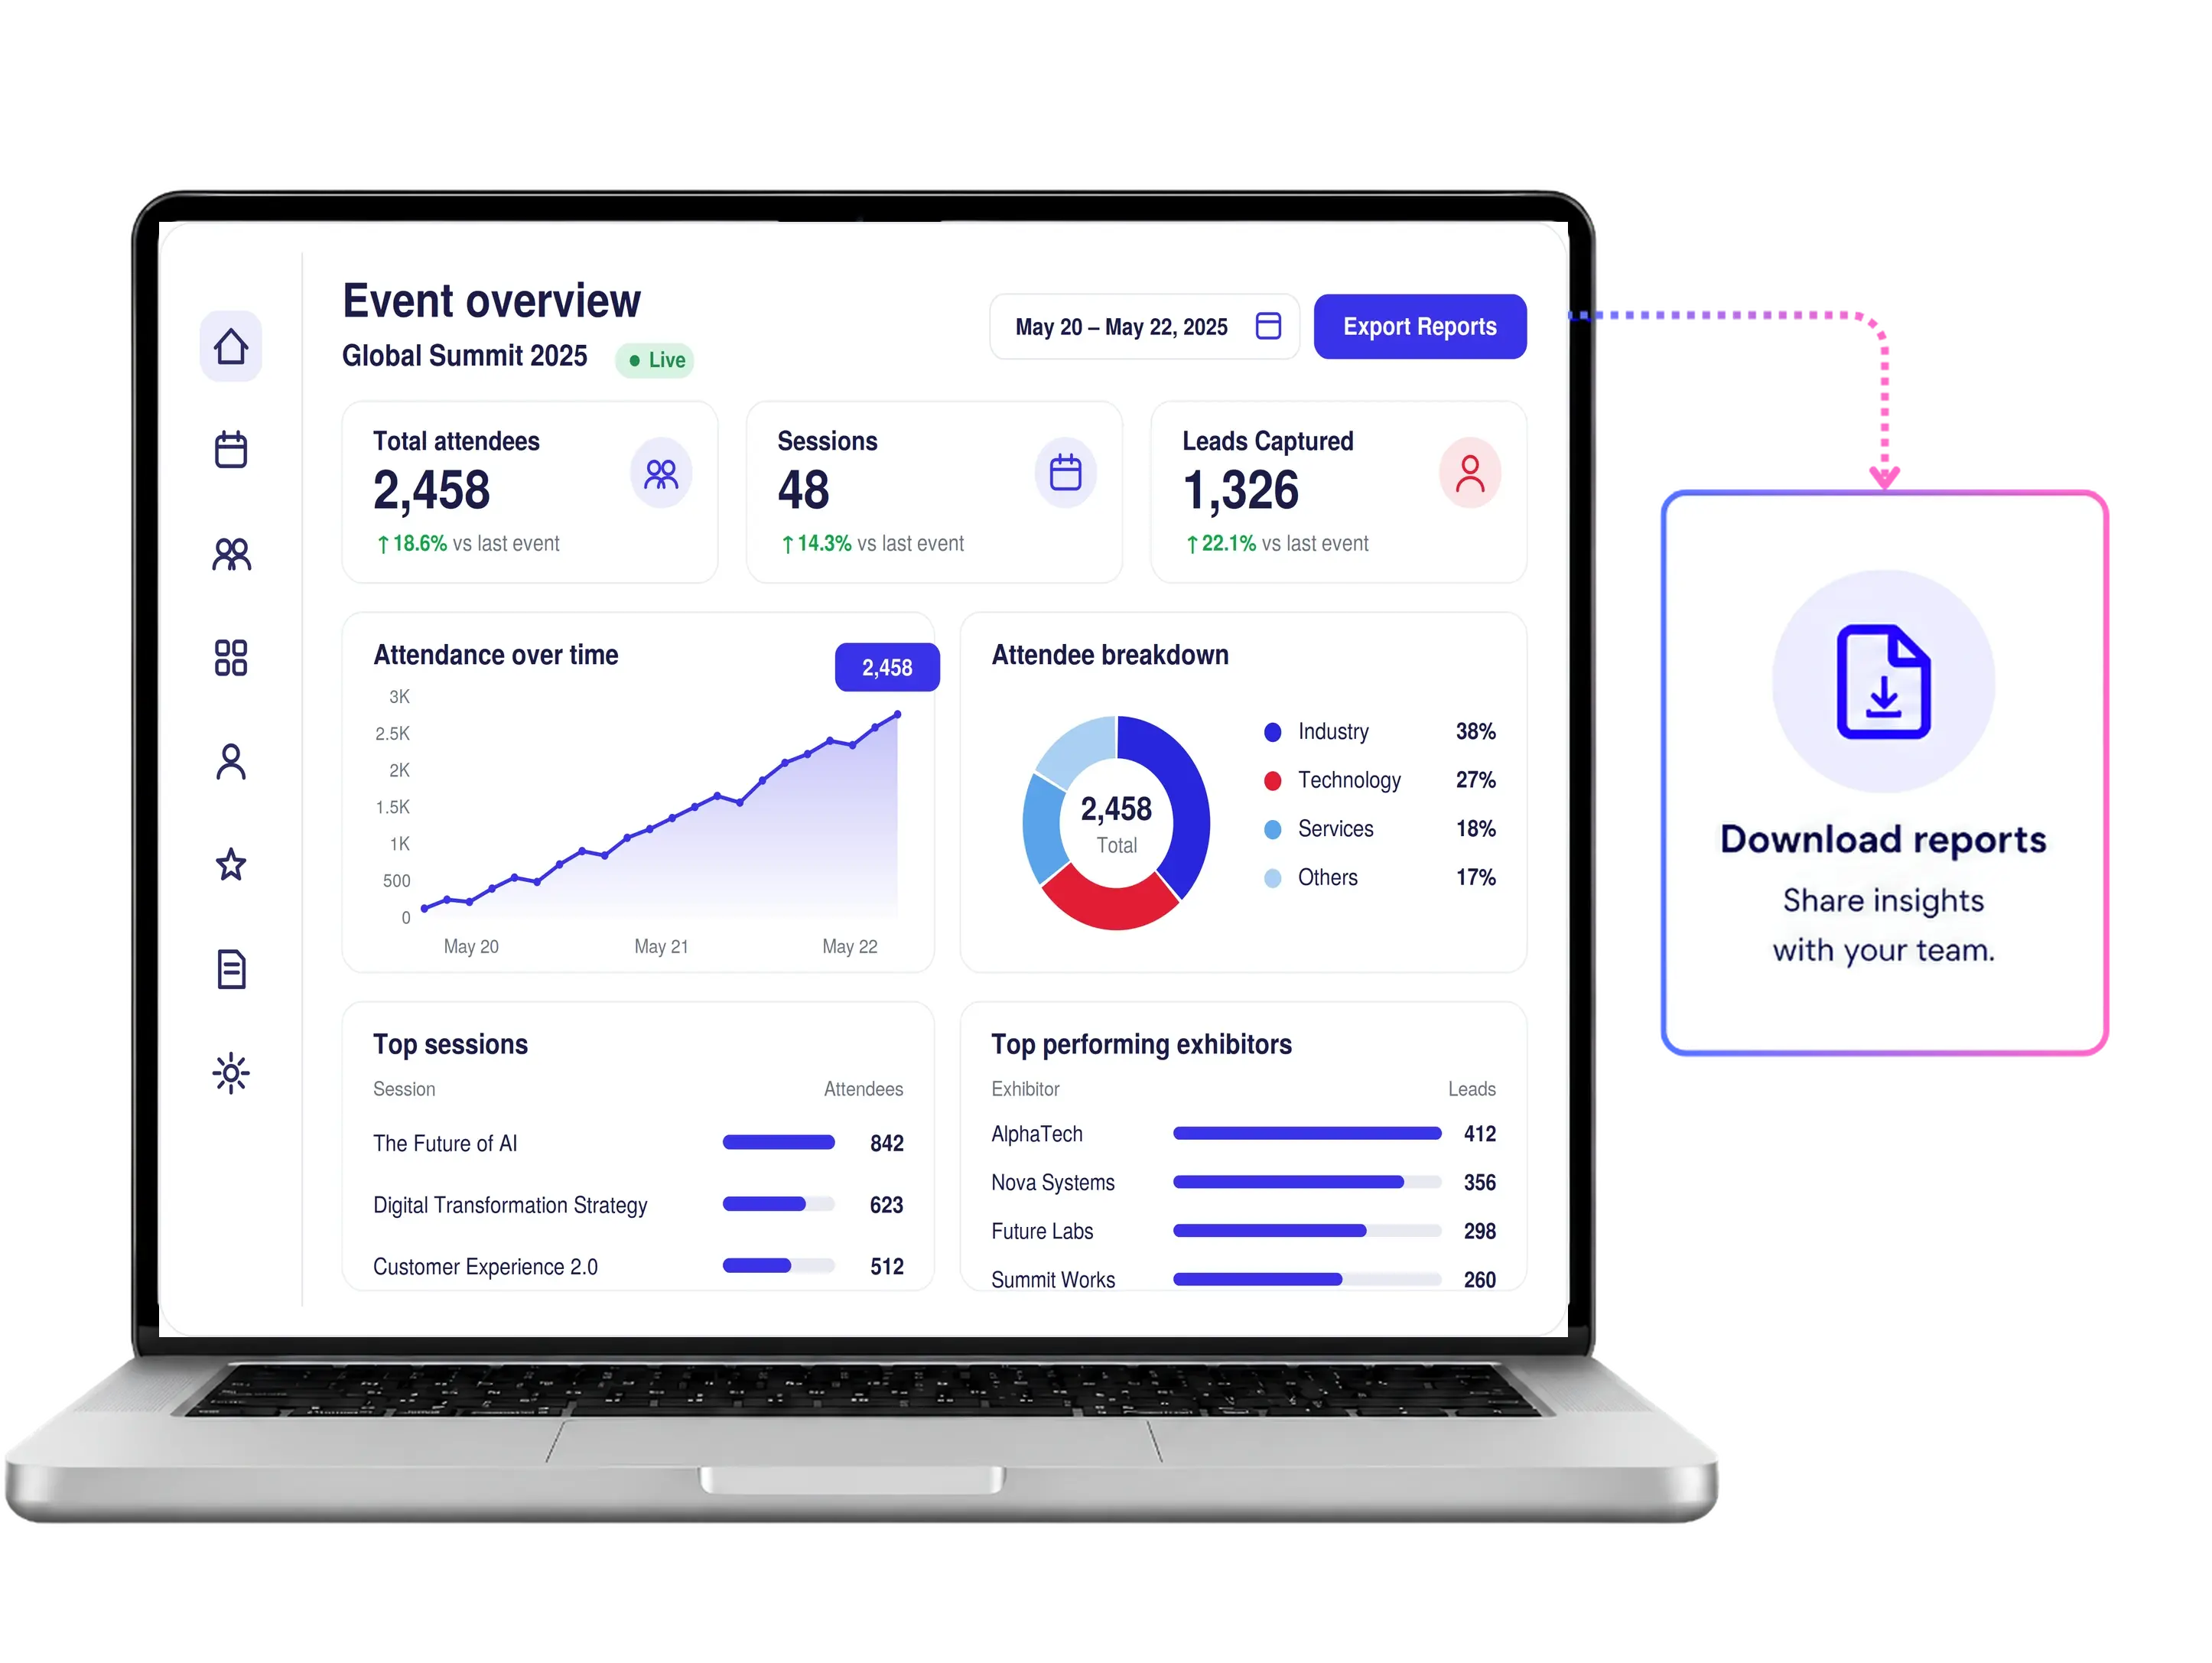
Turn onsite activity into clear reports that teams, sponsors, and stakeholders can actually use.
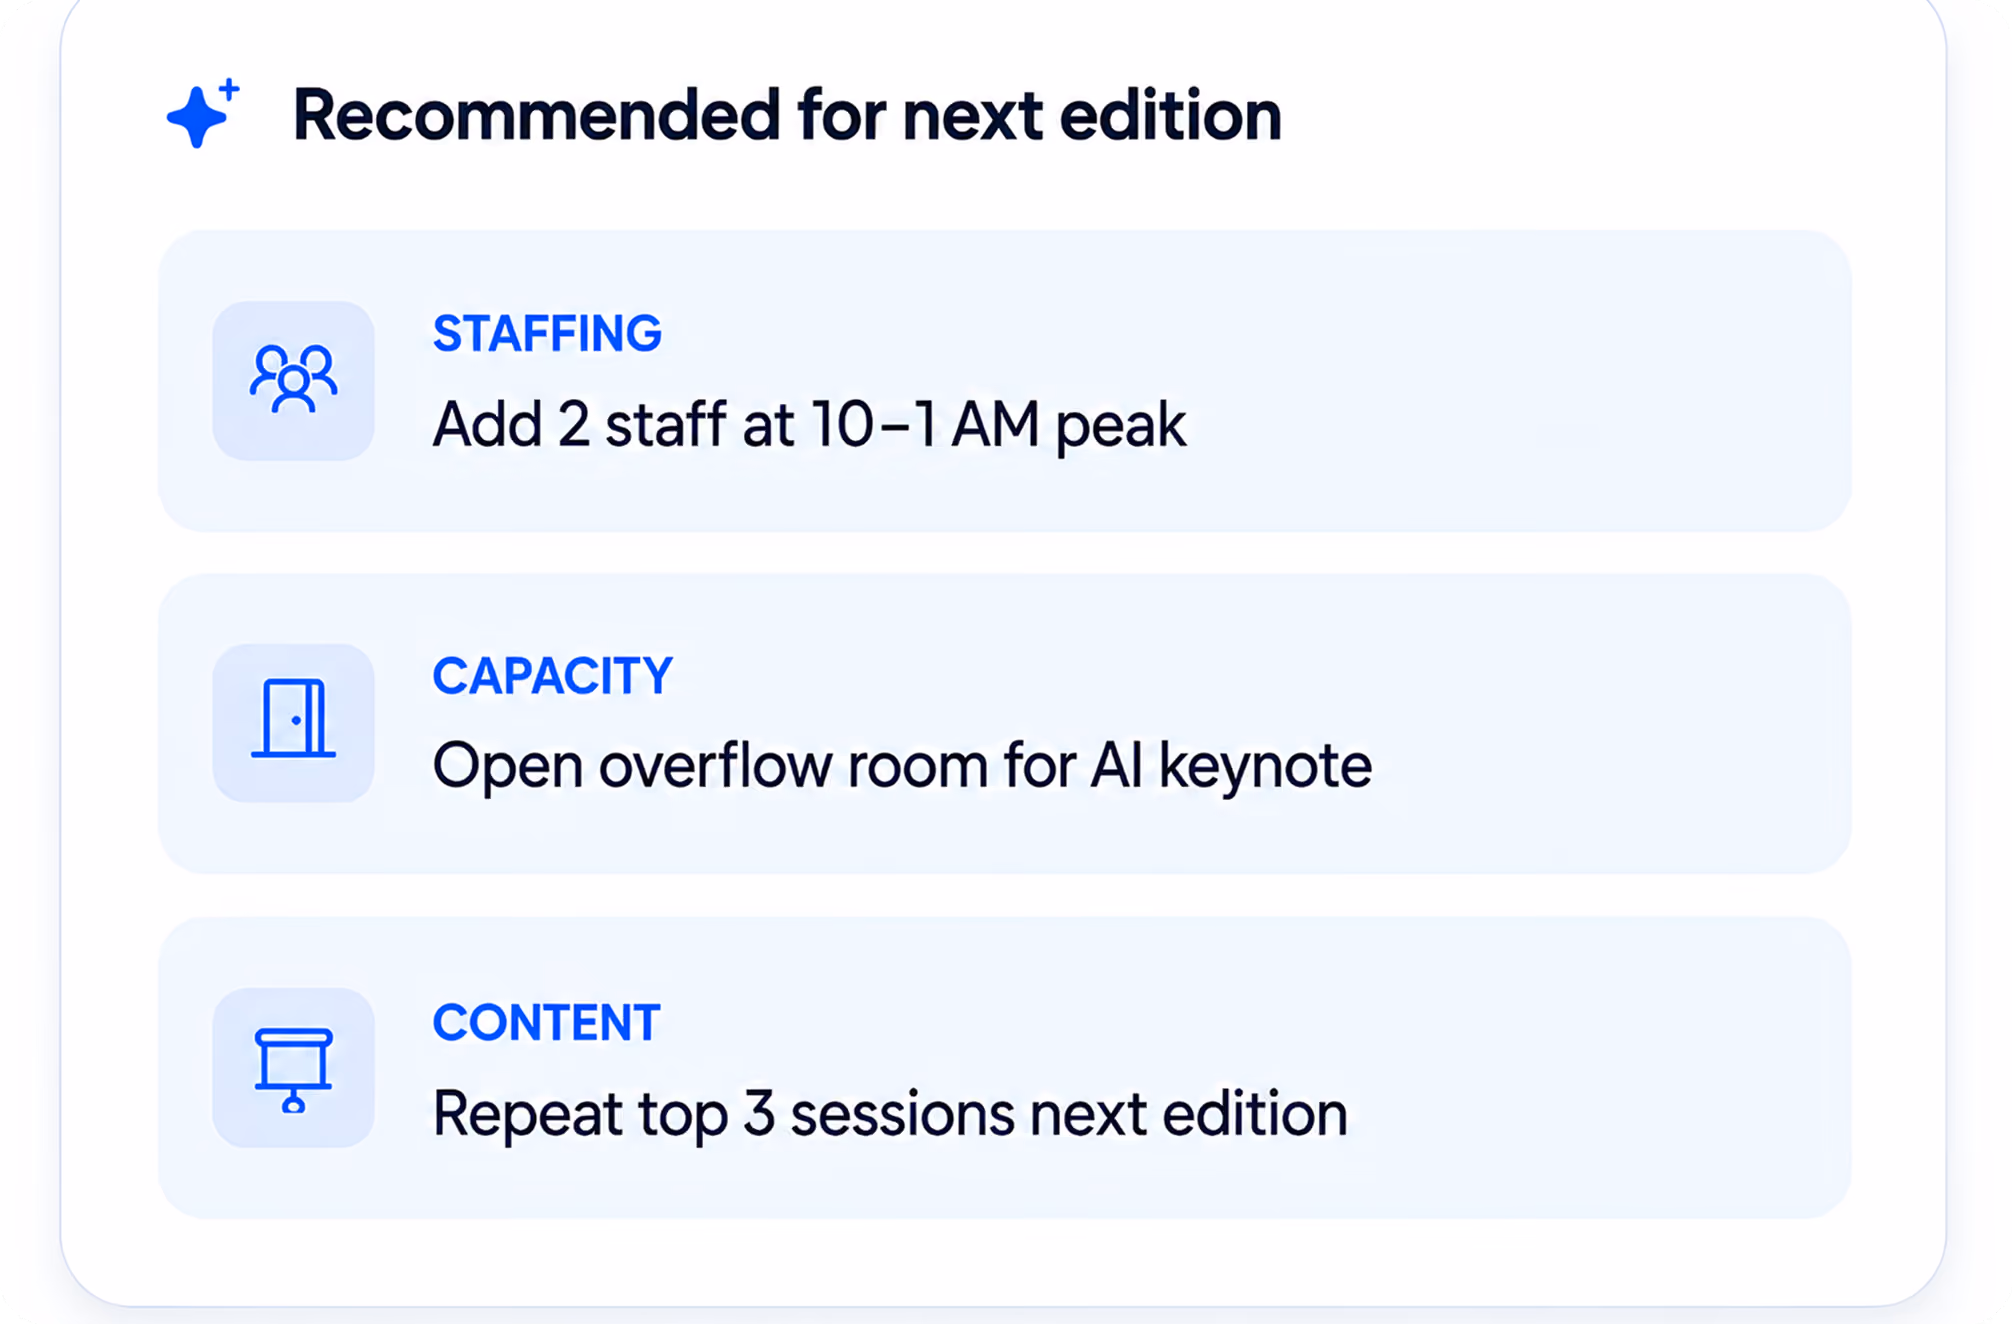
Use post-event analytics to understand what worked, what needs attention, and how the next edition can run better.
Watch the demo video to find out how our insights engine can help your event teams.
Use what happens onsite to plan your next event better, and to show exactly what this one delivered.

Use live and historical data to understand attendee flow, session demand, staffing, equipment usage, and future planning.
.svg)
Use event data to understand performance across attendees, sessions, exhibitors, sponsors, and lead activity.
Useful event analytics depend on trust. fielddrive Insights is designed to help organizers access the data they need while supporting secure, responsible data handling across the event lifecycle.
From attendee information to check-in records, session activity, and lead retrieval data, fielddrive helps teams manage insights through controlled workflows.

fielddrive Insights brings together data from the onsite touchpoints that shape your event experience. From arrivals to sessions to exhibitor engagement, it helps teams understand how people move, interact, and engage throughout the event.
.avif)
Track arrival flow, badge printing activity, attendee categories, and key check-in patterns.

Understand session attendance, access activity, attendee movement, and gated area performance.
.avif)
Measure exhibitor activity, lead capture performance, qualifier trends, and follow-up readiness.

Track attendance, sessions, check-ins, and attendee engagement across multi-day programs.
Understand visitor activity, exhibitor lead capture, session traffic, sponsor value, and event ROI.
Monitor attendance, employee participation, executive sessions, and onsite engagement.
Track member attendance, session participation, check-in flow, and event performance.
Support controlled access, attendee verification workflows, real-time visibility, and secure reporting.
Track attendance, accreditation, access points, crowd movement, and onsite engagement across sports events.

Onsite badge printing for custom, secure, and professional event badges.

Session scanning and access control for tracking attendance and managing restricted areas.
.svg)
Lead retrieval software for exhibitors, sponsors, and event sales teams.
.svg)
Self-check-in kiosks for faster onsite arrivals and smoother attendee flow.
fielddrive Insights is fielddrive’s connected event analytics and reporting layer. It brings together real-time tracking, dashboards, daily event reports, post-event analytics, and AI-powered query resolution across key onsite touchpoints.
An event analytics platform helps organizers collect, track, and analyze data from onsite touchpoints such as check-in, attendance, sessions, lead retrieval, and access control. It brings live event data and post-event analytics together, making it easier to create reports, measure performance, and improve future event planning.
fielddrive Insights uses AI-powered query resolution to help teams ask questions about authorized event data conversationally. This makes it easier to get quick answers without manually filtering reports or exports.
Yes. fielddrive Insights helps teams ask practical questions about live event data, including who has checked in, how many VIPs have arrived, which sessions are popular, or how many leads have been captured.
fielddrive Insights can help track event activity across check-in, badging, session scanning, access control, lead retrieval, attendee categories, company attendance, and onsite flow.
Yes. fielddrive Insights can provide visibility into check-in activity, badge printing, peak arrival times, attendee categories, VIP check-ins, no-shows, and related onsite registration trends.
Yes. When used with fielddrive Entry, fielddrive Insights can help organizers understand session attendance, access scans, dwell time, room activity, popular sessions, and attendee movement patterns.
Yes. When used with fielddrive Leads, fielddrive Insights can help track leads captured, exhibitor activity, lead qualifier trends, hot/warm/cold lead breakdowns, follow-up readiness, and sponsor or exhibitor performance.
Yes. fielddrive Insights helps organizers review post-event analytics across check-in, sessions, lead retrieval, attendance patterns, engagement trends, and onsite flow.
fielddrive supports secure handling of attendee, check-in, session, and lead data through controlled workflows, access-managed reporting, GDPR-conscious processes, and secure syncing across connected systems.
Yes. fielddrive Insights helps teams use historical event data to improve future capacity planning, staffing, equipment allocation, content decisions, session planning, and stakeholder reporting.
fielddrive supports platform-agnostic event workflows and integrations with registration platforms, CRMs, spreadsheets, and other event systems. Integration options depend on the systems being connected and the event setup.
Event analytics gives organizers a clearer view of attendee behavior and event performance. It helps teams identify trends and operational issues, measure event ROI with reliable data, demonstrate value to stakeholders, and make more informed decisions for future events.
Turn live event activity into clear insights, measure performance and ROI, and use AI-powered answers to plan smarter events.

.svg)
Sign up for our newsletter today.
.svg)