

.png)
Trade Show Badge Heatmap: Optimize Attendee Flow & ROI
Learn how a Trade Show Badge Heatmap helps you optimize layouts, monitor attendee movement, and enhance engagement at your next trade show or conference.
CONTENT
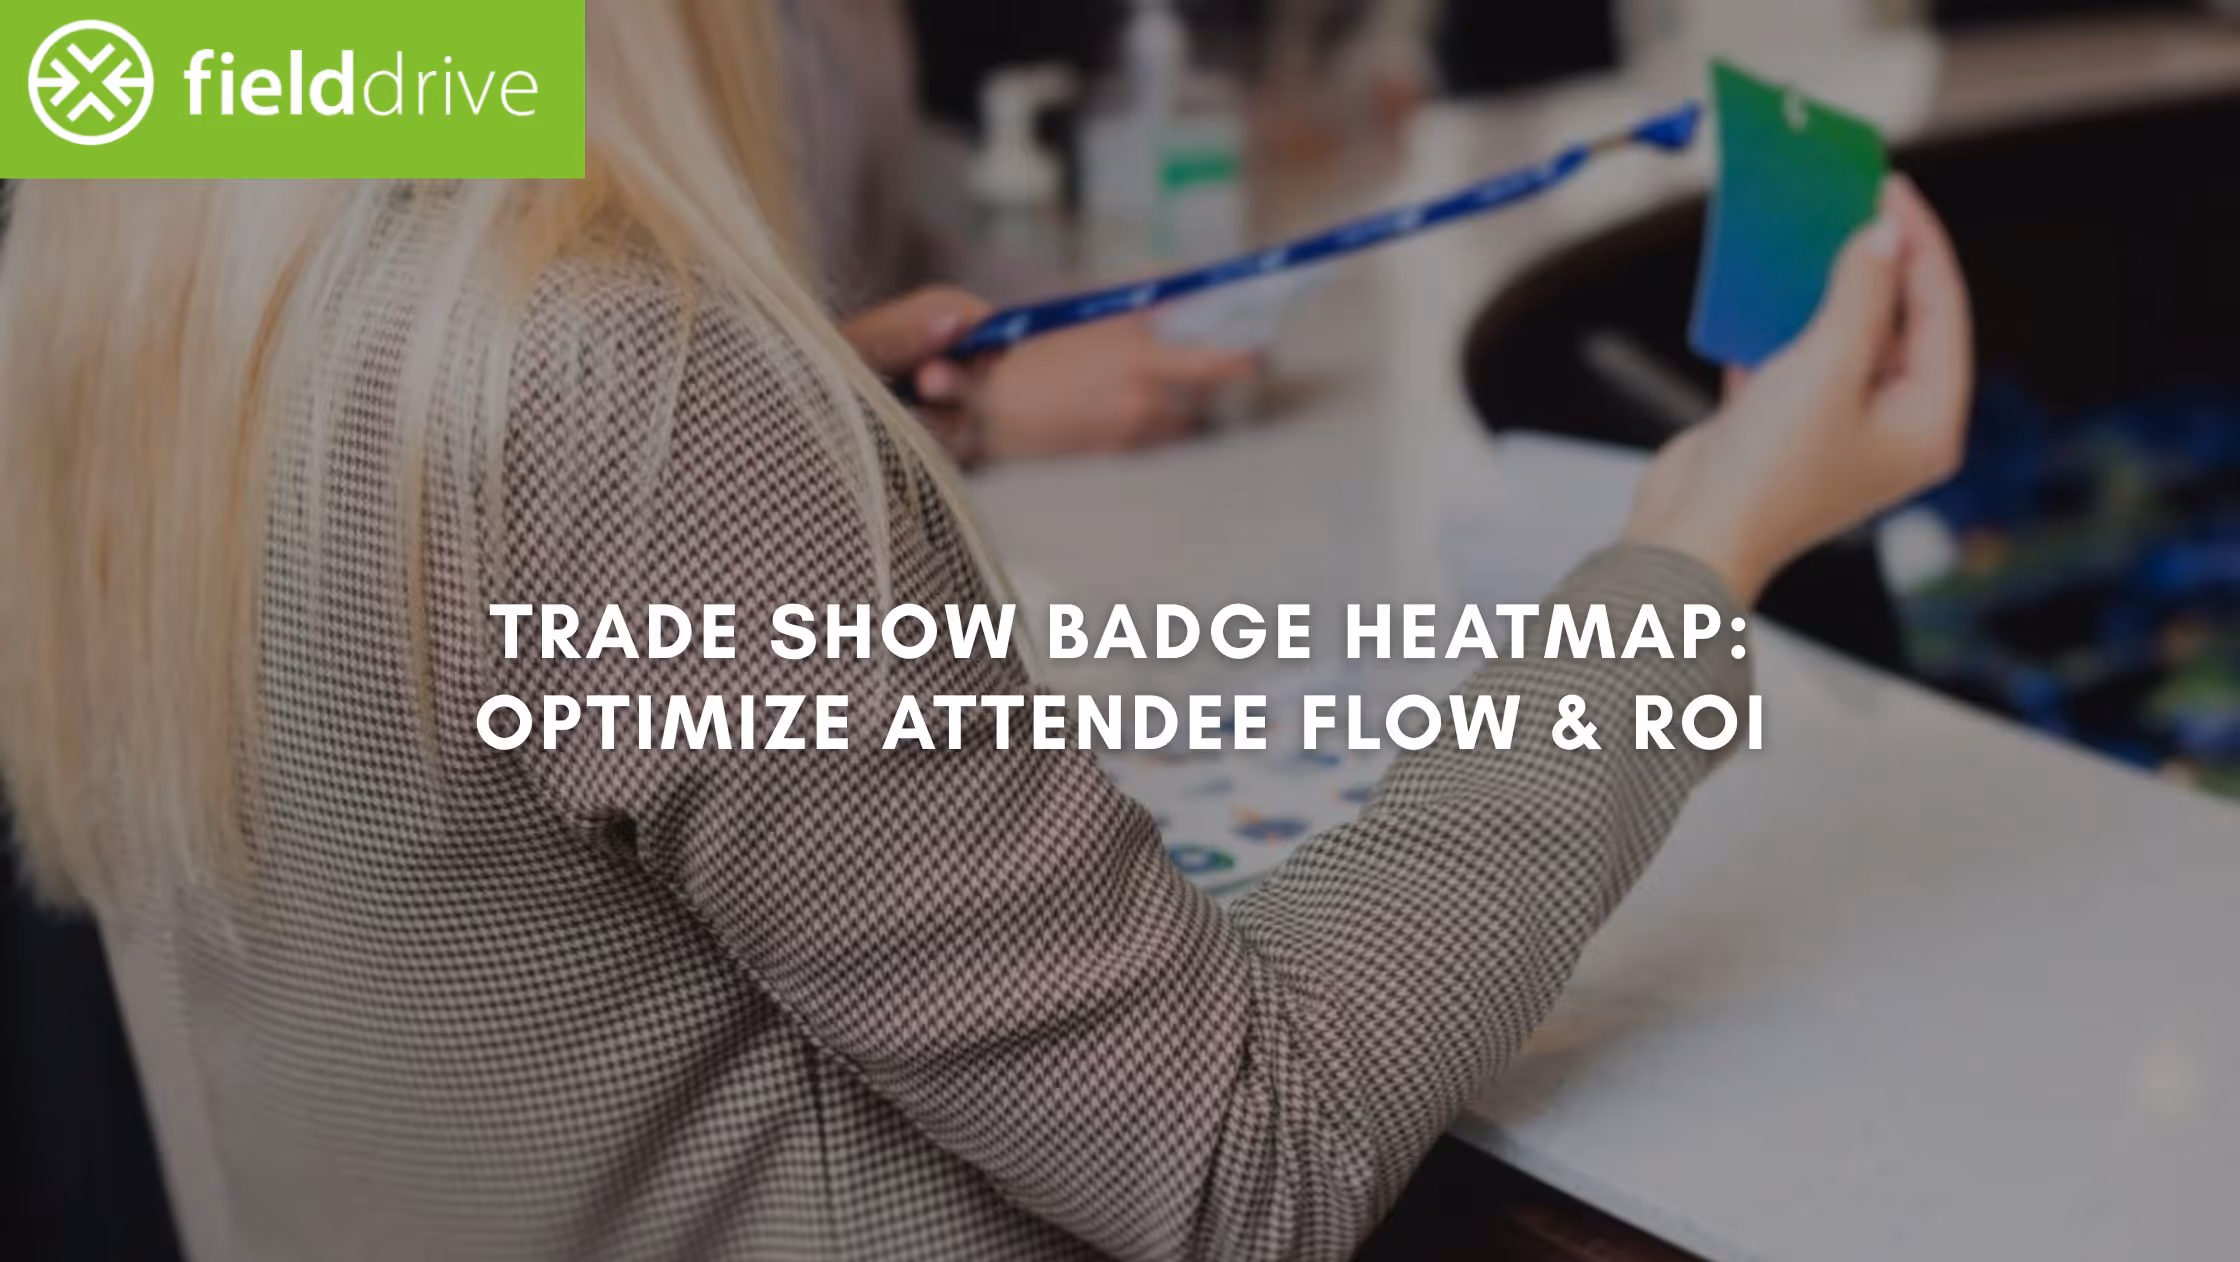
Trade shows are crowded, fast‑moving, and fiercely competitive, yet many exhibitors still struggle to see which areas of their booth truly capture attention. What if you could turn every badge scan into a visual story of foot traffic, engagement, and hotspots? That’s exactly what a Trade Show Badge Heatmap does: it makes attendee movement visible, actionable, and easy to analyze.
The stakes are high: 70% of attendees influence purchasing decisions, and over 60% of exhibitors now use data analytics to measure success. By tracking where visitors stop, move quickly, or interact, you can optimize booth layout, messaging, and engagement strategies.
In this blog, you’ll learn how trade show badge heatmaps convert raw attendee movement into actionable insights that help exhibitors improve engagement and maximize ROI.
Key Takeaways
- Visualize Attendee Movement: Heatmaps turn raw badge scans into clear visual insights of foot traffic, dwell time, and hotspots.
- Optimize Booth Placement: Identify high-traffic zones to position premium booths and maximize sponsor ROI.
- Enhance Engagement: Detect congestion or underused areas to improve attendee experience and traffic flow.
- Measure Lead Quality: Track repeat visits and interactions to prioritize genuinely interested prospects.
- Enable Data-Driven Decisions: Real-time and post-event analysis informs operational adjustments and future event strategy.
- Overcome Challenges: Address privacy, sensor placement, badge adoption, and data integration for accurate, actionable insights.
What is a Trade Show Badge Heatmap?
A Trade Show Badge Heatmap is a visual analytics tool that shows precisely where attendees gather, how they move, and which areas of the show floor get the most attention. Each attendee badge, embedded with QR codes, Bluetooth Low Energy (BLE) tags, or barcodes, acts as a data source. Every scan, detection, or interaction contributes to a real-time or post-event map of traffic density and dwell time.
For event organisers, this transforms raw movement into actionable insights: you can instantly see high-traffic zones, underused spaces, and movement patterns that inform both operational decisions and exhibitor strategy.
Now, let's see how these insights impact your event planning, exhibitor success, and attendee experience.
Why Trade Show Badge Heatmaps Are Crucial for Event Success?
Heat maps visually represent data intensity using colour gradients. Warmer colours like red or orange indicate high activity, while cooler colours like blue or green show lower engagement. They are typically organized in a grid format, with rows and columns representing zones, displays, or interactions. Each cell is coloured based on activity, making it easy to spot patterns, hotspots, and underutilised spaces.
Here are several ways heat maps deliver tangible value for event planning and execution:
- Optimising Exhibitor Placement: Identify which aisles and zones attract the most traffic and position premium booths, sponsor displays, or high-value exhibits in these areas. This improves visibility, attendee interaction, and sponsor ROI.
- Enhancing Attendee Experience: Detect bottlenecks, congestion, or underused spaces to adjust layouts, signage, or staffing in real time. Smoother traffic flow encourages longer dwell times and more meaningful engagement.
- Measuring Engagement & Lead Quality: Track dwell time, repeat visits, and attendee interactions to identify genuinely interested prospects. This helps exhibitors assess booth performance and prioritize high-quality leads over sheer volume.
- Reducing Cognitive Load: Colour gradients make patterns and trends easy to interpret at a glance. By simplifying complex data, organisers can focus on insights instead of deciphering raw numbers, making decisions faster and more effectively.
- Planning Future Events: Post-event heat map analysis highlights underused zones and high-performing areas, allowing organisers to refine floor plans, booth placement, and overall event strategy for upcoming trade shows.
Now, let’s explore how Trade Show Badge Heatmaps are built, which turn attendee movement into actionable insights.
How Trade Show Badge Heatmaps Are Built?
Trade show badge heatmaps combine innovative badge technology, sensors, and analytics to provide real-time and post-event insights that guide operational decisions and event strategy. Below are the key components that make this process possible, each playing a crucial role in capturing and interpreting attendee behavior:
1. Badge Technology
Attendee badges capture essential data that reflects where attendees go and how they interact with booths and zones. The type of badge technology affects the level of detail and real-time insight organizers receive. Their primary purpose is to collect data on location, dwell time, and interactions to generate actionable insights while ensuring compliance with privacy regulations.
- QR Codes or Barcodes: Scanned at checkpoints or by exhibitors for point-based tracking.
- RFID Tags: Allow continuous, real-time monitoring of attendee movement.
- Bluetooth Low Energy (BLE) Tags: Detect proximity and patterns without requiring manual scans.
- Facial Recognition Integration (Optional): Can link badge activity to attendee identity for faster check-ins and richer analytics.
2. Sensors and Scanners
Sensors and scanning devices capture the data emitted by badges and transmit it to analytics systems for processing. These devices play a critical role in generating accurate heatmaps, enabling event organizers to understand traffic flow, booth engagement, and overall attendee behavior in real time.
- Fixed Sensors: BLE anchors or foot-traffic sensors continuously monitor attendee movement throughout the venue.
- Handheld Scanners: Mobile apps or devices allow exhibitors to scan badges at booths for point-based tracking.
- AI-Powered Sensors: Analyze movement patterns automatically to highlight high-traffic zones and engagement hotspots.
3. Data Collection and Processing
Once badge data is captured, it is aggregated, timestamped, and processed to provide actionable insights on attendee behavior. This step transforms raw tracking information into meaningful patterns that help organizers optimize traffic flow, booth placement, and overall event management.
- Movement Paths: Visualize the routes attendees take throughout the venue.
- Dwell Time: Measure how long visitors stay in specific zones or at booths.
- Repeat Visits: Identify attendees returning to high-interest areas.
- Density Analysis: Highlight overcrowded or underutilized spaces to inform layout adjustments and staffing decisions.
4. Visualization and Dashboards
Processed badge data is presented in interactive dashboards as heatmaps, making complex movement patterns easier to understand. This allows organizers and exhibitors to quickly identify high-traffic areas, optimize booth placement, and make data-driven operational decisions.
- Color Gradients: Red indicates high activity, while blue or green represents lower engagement zones.
- Filters: Analyze data by time, specific zones, or attendee segments for more granular insights.
- Insights: Instantly highlights traffic flow and engagement levels, helping organizers allocate staff, adjust layouts, and enhance attendee experience.
5. Real-Time vs Post-Event Analysis
Trade show badge heatmaps provide actionable insights both during the event and after it concludes. Organizers can use these insights to make immediate adjustments and plan more effective layouts and engagement strategies for future events.
- Real-Time Analysis: Make instant adjustments to layouts, deploy staff, or manage congestion as it occurs.
- Post-Event Analysis: Identify which booths attracted the most attention, measure dwell times, and detect underutilized zones.
- Optimization: Refine floor plans, improve exhibitor placement, and enhance overall attendee engagement for future events.
Also Read: Custom Event Badges: Enhancing the Attendee Experience
Now that you understand how badge heatmaps work, here’s how to implement them effectively for your next event.
Implementing a Badge Heatmap Strategy for Your Next Event
To make the most of trade show badge heatmaps, event organizers need a clear, step-by-step approach that turns attendee data into actionable insights. Here’s a structured approach to implement it effectively:
Step 1. Choose Your Technology Stack
Select the right badge type and sensors to suit your venue, budget, and data needs.
- Decide on badge type: QR codes, BLE, or RFID.
- Choose sensors or lead-retrieval tools: mobile apps, handheld scanners, or fixed anchors.
- Ensure compatibility with your heatmap analytics platform for seamless data capture.
Step 2. Design Your Data Plan
Clearly define what you want to measure and where to collect it.
- Identify key metrics: footfall, dwell time, repeat visits, and conversion rates.
- Map sensor or scanning station placement to capture movement effectively.
- Plan for real-time and post-event data collection for both operational and strategic insights.
Step 3. Communicate With Stakeholders
Transparency and alignment with sponsors, exhibitors, and attendees are essential.
- Sponsors: Show how heatmaps demonstrate traffic and engagement.
- Exhibitors: Explain how badge scans prove lead quality and ROI.
- Attendees: Provide clear communication on data collection, privacy, and usage.
Step 4. Activate During the Event
Use heatmaps in real time to enhance operations and attendee experience.
- Monitor live dashboards for traffic flow and dwell times.
- Redeploy staff, adjust signage, or address congestion points immediately.
- Identify high-interest zones and optimize engagement opportunities.
Step 5. Analyse Post-Event
Turn collected data into actionable insights for future events.
- Export heatmap reports for review and analysis.
- Combine with lead retrieval data to correlate foot traffic with lead quality.
- Identify layout improvements, booth placement adjustments, and operational optimizations.
Step 6. Refine and Scale
Continuously improve your badge heatmap strategy to maximize results across events.
- Test different badge technologies, sensor placements, and visualizations.
- Share insights with sponsors, booth teams, and event design teams.
- Use iterative learning to enhance attendee experience, exhibitor ROI, and operational efficiency at future events.
Want complete visibility into attendee movement and engagement at your events? fielddrive gives you real-time tracking and analytics to optimize operations, improve engagement, and make data-driven decisions. Get started today!
Also Read: Boost Attendee Engagement at Conferences with Eye-Catching Custom Event Badges
Key Challenges and Solutions for Effective Badge Heatmap Use
While trade show badge heatmaps offer powerful insights, event hosts face several operational and strategic challenges. Addressing these ensures accurate data, better attendee experience, and higher ROI for exhibitors:
1. Privacy & Compliance
Collecting attendee movement data can raise privacy concerns, especially under GDPR in the UK.
Best Practices:
- Clearly communicate at registration or check-in how attendee data will be collected, stored, and used to maintain trust and compliance.
- Use anonymised or aggregated data whenever possible to protect individual privacy while still gaining actionable insights.
2. Sensor Accuracy & Placement
Poorly positioned BLE sensors or anchors can create blind spots, resulting in incomplete or inaccurate data.
Best Practices:
- Strategically place sensors in high-traffic and key engagement zones to capture meaningful movement patterns.
- Perform regular calibration and testing to ensure the data collected is accurate and consistent throughout the event.
3. Badge Adoption
Limited adoption of BLE-enabled badges can reduce data coverage and insights.
Best Practices:
- Promote full badge adoption by clearly explaining the benefits to attendees, such as enhanced networking and personalized experiences.
- Provide kiosks or staff assistance to support scanning and registration, ensuring maximum participation.
4. Data Integration
Heatmap insights lose value if they cannot be linked with CRM, lead retrieval, or reporting systems.
Best Practices:
- Connect heatmap data with CRM systems, lead management systems, and post-event reporting platforms to create a unified view of engagement.
- Use intuitive dashboards to enable operations teams and leadership to translate data into actionable decisions quickly.
5. Interpreting the Data Correctly
High traffic areas do not always indicate effective engagement; context is essential.
Best Practices:
- Cross-reference heatmap data with dwell time, interactions, and conversions to identify genuinely engaged attendees.
- Consider external factors like demos, giveaways, or food stations when evaluating hotspots to avoid misinterpretation.
By proactively addressing these challenges, event organisers can maximize the value of trade show badge heatmaps, enhance attendee engagement, and deliver measurable ROI to exhibitors and sponsors.

How fielddrive Helps you Gain Actionable Attendee Insights?
Understanding attendee behavior is crucial for smooth event operations and meaningful engagement. fielddrive turns every badge scan, session check-in, and attendee interaction into real-time insights, giving organizers full visibility and control. With advanced facial recognition and integrated analytics, event teams can make informed decisions to improve flow, session management, and exhibitor follow-ups.
Key Features:
- Facial Recognition Check-In: Speed up attendee entry with facial recognition or QR scanning for a smooth, contactless experience.
- Real-Time Analytics: Instantly see which sessions are most popular, helping adjust layouts, timing, and content delivery.
- Touchless Check-In Kiosks: Automated, hygienic kiosks enable high-traffic events to run safely and efficiently, allowing attendees to check in quickly and maintain a smooth flow from the moment they arrive.
- On-Demand Badge Printing: Personalized badges printed quickly on-site reduce pre-event preparation and make a professional impression.
- Lead Retrieval Tools: Exhibitors can capture attendee information in real time, enabling personalized follow-ups and improving ROI through faster, more thoughtful engagement.
Gain actionable insights for your events with fielddrive. Streamline check-ins, track attendee engagement in real time, and make data-driven decisions effortlessly. Request a free demo today!
Final Thoughts
Trade show floors are busy and fast-moving, making it hard to track attendee behaviour. A Trade Show Badge Heatmap converts movement data into clear insights, highlighting foot traffic, hotspots, and interactions. Organisers can use this information to optimise booth placement, improve engagement, and make data-driven decisions that increase ROI for exhibitors and sponsors.
To make this process seamless, fielddrive centralizes check-ins, tracks session participation, and delivers real-time analytics for smarter event management. By connecting all attendee touchpoints, organisers can enhance engagement, optimise session flow, and utilize actionable insights to plan even more effective events.
Ready to transform attendee data into results? Contact us today to see how fielddrive can make your event run smarter, smoother, and more successfully.
FAQs
1. How quickly can badge heatmap data be processed during an event?
A. Modern badge heatmap systems provide near real-time analytics, allowing organisers to monitor attendee movement and hotspot activity as the event unfolds. This enables on-the-fly adjustments to booth placements, signage, or staffing, ensuring better crowd flow and maximized engagement during the event.
2. Can heatmaps help identify which products or services attract the most attention?
A. Yes. By linking attendee dwell times and interactions to specific booths, displays, or demos, heatmaps reveal which products attract the most interest. Exhibitors can use this insight to prioritize demonstrations, allocate staff, or replicate high-performing setups at future events.
3. Are heatmaps effective for both large expos and smaller conferences?
A. Absolutely. While large trade shows benefit from mapping complex traffic patterns, even smaller conferences can use heatmaps to track session attendance, networking hotspots, and booth interactions. The data helps optimise layouts, enhance engagement, and improve ROI, regardless of event scale.
4. How do badge heatmaps complement other event analytics tools?
A. Badge heatmaps integrate with CRM, lead retrieval, and post-event reporting tools, providing contextual insights beyond foot traffic. Combined, these systems allow organisers to correlate movement patterns with lead quality, session participation, and overall engagement, enabling more informed event strategy decisions.
5. Can heatmaps improve attendee safety during crowded events?
A. Yes. By identifying congestion points and high-traffic areas, heatmaps help organisers manage crowd flow and reduce bottlenecks. This supports emergency planning, optimizes staffing, enhances attendee safety, and improves the overall experience and engagement at the event.
.svg)
.svg)
.svg)
Want to learn how fielddrive can help you elevate your events?
Book a call with our experts today

.svg)