

.png)
How to Create a Post-Event Report: Examples and Format Guide
Learn how to create a post-event report with our guide and event reporting examples. Analyze event success and improve future events with detailed reports.

CONTENT
Are you missing out on valuable insights by skipping a post-event report that could elevate your future events? A successful event doesn’t end when the doors close—it’s only complete when you’ve analyzed how it performed.
Post-event reporting is one of the key methods for understanding your event’s impact and making informed decisions for future success. In fact, 65% of event organizers are tasked with reporting and measuring event success, which shows just how crucial this step is.
In this post, we’ll explore what post-event reporting is, why it’s essential for continuous improvement, and how you can create a comprehensive report. Plus, we’ll provide event reporting examples and tips to simplify the process.
What is an Event Report?
An event report is a detailed summary of your event’s outcomes, covering everything from attendance and engagement to finances and marketing effectiveness. It’s a tool that allows you to analyze the event's success, pinpoint areas for improvement, and gather insights for future planning. It’s essential for measuring ROI and justifying the event’s value to stakeholders.
Importance of a Post-Event Report
- Helps identify what worked well and where improvements are needed.
- Provides a clear evaluation of your event’s return on investment (ROI) and overall financial success.
- Acts as a valuable record, serving as a reference point for planning future events.
- Demonstrates event impact and success, which can help secure future sponsorships and funding.
- Offers insights into attendee engagement, helping tailor future event experiences to better meet audience expectations.
- It allows you to review logistical execution, help refine operations, and ensure smoother events moving forward.
- Aids in aligning your team and stakeholders by providing a transparent overview of the event’s performance.
What to Include in Your Post-Event Report?
A well-structured post-event report should cover all essential aspects to give a complete picture of your event’s performance. Here’s everything you should include:
- Target Audience
- Identify key stakeholders and departments who will use the report.
- Event Name
- Team
- List of team members responsible for the event.
- Mission Statement or Event Objective
- Attendee Demographics
- Breakdown by age, location, industry, etc.
- Event Agenda
- Budget
- Include expenditures, revenue, and overall financial outcomes.
- Data and Analytics
- Attendance
- MQLs/Pipeline/Bookings
- Lead generation numbers
- Trade Show Recap
- Summary of participation and booth interactions (if applicable).
- Event Marketing
- Performance of marketing channels, social media reach, impressions, and engagement.
- Attendee Satisfaction
- Feedback, surveys, and overall attendee experience.
- Event Content
- Breakdown of sessions, keynotes, or workshops.
- Sponsorship
- ROI for sponsors and their impact on the event.
- Key Takeaways
- Major insights or lessons learned that can be applied to future events.
- Technology Performance
- Evaluation of tech tools used (check-in systems, lead retrieval, etc.) and their overall effectiveness.
- Logistics Review
- Analysis of the event’s logistics, including venue setup, catering, and operational efficiency.
- Media Coverage
- Include press mentions, media partnerships, and external event coverage (if applicable).
Note: While this list covers a wide range of key elements, make sure to include only what applies to your event. Tailor the report to focus on the most relevant data and insights for your specific needs and objectives.
Step-by-Step Guide to Creating a Post-Event Report
Creating a post-event report can feel overwhelming, but breaking it down into clear, manageable steps simplifies the process. A structured report lets you capture all relevant details, measure event success, and provide actionable insights for future improvements. Let’s walk through each step to ensure your report is thorough and impactful.
#1 Gather Data and Information
The foundation of any post-event report is the data you collect. Gathering accurate and relevant data ensures your report is insightful and actionable. Here’s what to collect and how to do it efficiently:
- Attendance Numbers: Pull data from your registration platform or check-in system like fielddrive to capture the exact number of attendees.
- Financial Records: Collect expenditure reports and revenue from ticket sales, sponsorships, or exhibitor fees. This information should come from your event budget tracker.
- Participant Feedback: Use post-event surveys or feedback forms sent via email or event apps to gather attendees' opinions on the event experience.
- Marketing Materials: Compile metrics from your email campaigns, social media engagement, and ads. This data can be gathered from platforms like Mailchimp, Facebook Insights, or Google Analytics.
- Lead Data: For trade shows and conferences, use lead retrieval tools to capture attendee information at booths or during networking sessions.
- Event Content Performance: Use event management software or attendee feedback forms to track engagement metrics for sessions, keynotes, or workshops.
- Onsite Engagement Metrics: Leverage data from mobile apps, RFID, or NFC technology to monitor foot traffic patterns or session attendance for in-depth engagement insights.
Using fielddrive’s onsite solutions, you can track attendance and attendee activity in real time, ensuring accurate data for your post-event report.
#2 Define the Report’s Structure
A well-organized report ensures your insights are easy to follow and digest. Defining a clear structure from the start will keep your report concise, professional, and impactful. Here’s how to do that:
- Identify the report’s purpose: Determine whether it’s for internal team analysis, stakeholders, sponsors, or all of the above. This will shape how detailed the sections need to be.
- Decide on key sections: Outline the main sections, such as an executive summary, financial analysis, and attendee feedback. Keep these consistent across all event reports for easier comparisons.
- Use a logical flow: Begin the report with high-level insights (like an executive summary) and gradually move into specific details (like analytics and financials).
- Choose the format: Decide between a narrative format, bullet points, or a combination of both. Keep the format consistent, and consider adding visuals like graphs to simplify complex data.
- Tailor the length: Ensure the report is concise and focused. For senior management or sponsors, focus more on high-impact metrics and summaries, while internal reports can include more granular details.
#3 Create Executive Summary
The executive summary is the first thing readers will see, so it needs to deliver a clear, concise overview of the event’s purpose, outcomes, and key findings. This section sets the tone for the entire report and provides high-level insights at a glance. Here’s how to create a compelling executive summary:
Provide an overview of the event:
- Summarize the event’s purpose, objectives, and target audience. Include basic details such as the event name, date, location, and audience demographics.
- Example: "The Tech Innovations Summit 2024, held on March 10th in Chicago, aimed to connect industry leaders with cutting-edge technology solutions, attracting 500 attendees from the tech and business sectors."
Highlight key findings:
- Mention top insights from the event, such as the number of attendees, ROI, or overall satisfaction. Focus on metrics that align with the event’s objectives.
- Example: "The event achieved a 30% increase in attendee engagement compared to last year, with an 85% satisfaction rate across all participants."
List main achievements:
- Highlight significant successes, such as attendance milestones, sponsorship deals, or media coverage. This will give stakeholders an immediate understanding of what went well.
- Example: "Secured three new sponsors and exceeded registration targets by 15%."
Address challenges faced:
- Briefly touch on any logistical or operational issues, and how they were handled or can be improved for future events. This shows transparency and room for growth.
- Example: "The event experienced a minor check-in delay due to technical issues, which the support team resolved in under 30 minutes."
Keep it concise and focused:
- Limit the summary to one or two paragraphs, making sure it covers all key points without going into too much detail.
- Use bullet points for easy reading if needed.
#4 Evaluation of Event Success
Evaluating the success of an event requires looking beyond just attendance numbers. It involves assessing various metrics that directly reflect how well the event achieved its objectives. A thorough evaluation helps you understand both the strengths and areas for improvement, making it essential for future planning. Here’s how to evaluate event success:
- Measure attendance vs. target numbers: Compare actual attendance to your registration goals and no-show rate. For instance, if 1,000 people registered and 850 attended, calculate the attendance rate and analyze any gaps.
- Assess attendee satisfaction: Use post-event surveys to gather feedback on overall experience, content quality, and logistics. For example, ask attendees to rate sessions and speakers, and analyze the average satisfaction score.
- Track engagement levels: Measure participation in sessions, workshops, and networking activities. Look at attendee interaction with event apps, live polls, and social media mentions to gauge engagement. For Example: "60% of attendees used the event app to participate in live Q&A sessions, and the event hashtag was mentioned over 500 times on Twitter."
- Analyze leads generated: For trade shows or conferences, assess the number and quality of leads generated for exhibitors. Use lead retrieval data to track how many leads were captured and how many converted into potential sales.
- Compare results to event objectives: Revisit the event goals you set at the beginning. If one goal was to drive networking opportunities, look at the number of networking sessions attended and the success of those in facilitating connections.
#5 ROI and Budget Analysis
A solid budget analysis provides a clear financial picture of your event, showing whether it met its financial goals and where improvements can be made. Analyzing both expenditures and revenue helps you understand the event’s ROI and assess areas for future cost optimization. Here’s how to analyze your event budget effectively:
Conduct a thorough budget analysis:
- Start by comparing the projected budget to actual spending. Break down costs into categories like venue, catering, marketing, staff, and technology.
- Example: "The actual spend on marketing was $5,000, 20% lower than the projected $6,250 due to better-than-expected organic reach."
Evaluate revenue sources:
- Review all income streams, including ticket sales, sponsorships, and exhibitor fees. Compare actual revenue with your original targets to assess if financial goals were met.
- Example: "Sponsorship revenue exceeded expectations, contributing $50,000 compared to the initial $40,000 goal."
Discuss financial challenges:
- Identify any areas where costs exceeded the budget, such as unforeseen expenses or areas where savings weren’t achieved. Highlight any overspending and the reasons behind it.
- Example: "Logistics costs were higher than anticipated due to last-minute shipping charges, adding an extra $2,000 to the budget."
Highlight financial successes:
- Emphasize areas where the event stayed under budget or achieved greater-than-expected revenue. Use these insights to inform future financial planning.
- Example: "By securing in-kind sponsorships for audio-visual equipment, we saved $10,000 on rental fees."
Calculate ROI:
- Subtract total costs from total revenue and divide by cost to calculate ROI. This will show the event’s profitability and help justify its value to stakeholders.
- Example: "With a total revenue of $200,000 and total costs of $150,000, the event achieved a 33% ROI."

#6 Marketing and Promotional Strategies
Analyzing your marketing and promotional strategies is essential to understanding how well your efforts translated into event awareness and attendee engagement. This section helps you identify which tactics drove the most value and which could be improved for future events. Here’s how to analyze your marketing and promotional strategies effectively:
Evaluate the effectiveness of marketing channels:
- Assess each marketing channel used—email campaigns, social media, paid ads, partnerships, etc. Compare actual results with your pre-event goals.
- Example: "Email campaigns contributed to 40% of total registrations, outperforming social media ads, which stood at 25%."
Track social media reach and impressions:
- Measure your event’s visibility by reviewing the reach, impressions, and engagement rates across all social media platforms. Tools like Facebook Insights and Twitter Analytics can help capture these metrics.
- Example: "The event hashtag garnered 50,000 impressions across Twitter and Instagram, with 2,000 direct interactions."
Analyze attendee engagement:
- Review metrics like likes, shares, comments, and participation in social media contests or live event updates. This helps you assess the impact of your promotional efforts on potential attendees.
- Example: "The live Q&A session on Instagram saw 300 participants, generating significant attendee interaction and brand visibility."
Measure the impact of paid advertising:
- Compare the ROI of paid campaigns, such as Google Ads or sponsored posts, to determine if they delivered a strong return based on the budget spent.
- Example: "Google Ads generated 200 registrations at a cost-per-acquisition of $10, staying within the allocated budget."
Review content marketing performance:
- Analyze blog posts, articles, or videos created for the event. Track website traffic, engagement, and lead conversions from this content.
- Example: "The pre-event blog posts drove 5,000 visitors to the event landing page, contributing to 10% of overall ticket sales."
#7 Review Event Logistics
Reviewing event logistics is crucial in evaluating how well the operational aspects of your event were executed. Assessing each logistical component helps identify areas for improvement and ensures a smoother experience in future events. Here’s what logistics to review and how to evaluate them effectively:
- Venue Management: Evaluate how well the venue accommodated your event needs, considering factors like space, layout, and accessibility.
- On-site Check-in and Registration: Analyze the efficiency of the check-in process by reviewing wait times, attendee satisfaction, and any technical issues with badge printing or check-in kiosks.
- Catering and Refreshments: Assess how well catering services met attendees' expectations regarding food quality, availability, and overall service experience.
- AV and Technical Equipment: Review the performance of audio-visual systems and other technology used during the event, checking for any glitches or disruptions.
- Transportation and Parking: Examine the convenience and availability of transportation options for attendees, including parking facilities, shuttle services, or public transport access.
- Staff and Volunteer Coordination: Evaluate how effectively staff and volunteers were managed, ensuring that roles were clearly defined and that the team could handle onsite tasks efficiently.
#8 Collect Stakeholder Feedback
Collecting feedback from stakeholders, such as sponsors, partners, and key team members, is crucial for evaluating the event’s overall success. Their insights can provide valuable perspectives on what worked well and what could be improved in future events. Here’s how to gather stakeholder feedback effectively:
- Conduct post-event surveys: Send out tailored surveys to stakeholders shortly after the event to capture fresh feedback. Use a mix of open-ended and multiple-choice questions to gather both quantitative and qualitative insights.
- Host debrief meetings: Organize meetings with internal teams, sponsors, and partners to discuss their experiences. Focus on event goals, achievements, and areas for improvement.
- Use feedback forms: Create a specific feedback form for sponsors and partners to evaluate how well the event met their expectations, including brand exposure and audience engagement.
- Encourage direct communication: Provide opportunities for stakeholders to share their feedback directly via email or scheduled calls. Personal communication can reveal deeper insights than standard surveys.
- Track feedback metrics: Analyze common themes in feedback, including satisfaction with logistics, ROI for sponsors, and alignment with event objectives.
- Acknowledge feedback and follow up: Respond to stakeholders' feedback, showing appreciation for their input and outlining how it will be used to improve future events.
#9 Reflect on Lessons Learned
Reflecting on lessons learned is an essential part of post-event evaluation. This step helps you identify key takeaways from the event, which can inform better planning and execution in the future. Here’s how you can do that:
- Review successes and challenges: Identify what went well and what didn’t. Focus on both logistical and engagement outcomes.
- Analyze feedback: Incorporate insights from attendee and stakeholder feedback to highlight key areas for improvement.
- Document key takeaways: Write down the most important lessons and strategies to implement or avoid for the next event.
- Share lessons with the team: Hold a debrief meeting to discuss the takeaways with the entire team, ensuring everyone understands the improvements needed.
#10 Conclude with Actionable Insights
When concluding your event report, it's essential to transform the data and feedback into clear, actionable insights. This ensures your report doesn’t just highlight outcomes but also drives future improvements. Here’s how to effectively conclude with actionable insights:
- Summarize key findings: Highlight the most important takeaways from your evaluation, focusing on areas of success and those needing improvement.
- Provide clear recommendations: Based on the data and feedback, offer specific suggestions for changes or enhancements that can be made for future events.
- Link insights to measurable goals: Tie your recommendations to measurable outcomes, such as increasing attendee engagement or improving ROI, so the team has clear objectives.
- Prioritize actions: Indicate which insights should be addressed immediately and which can be considered for long-term improvements.
Event Reporting Examples
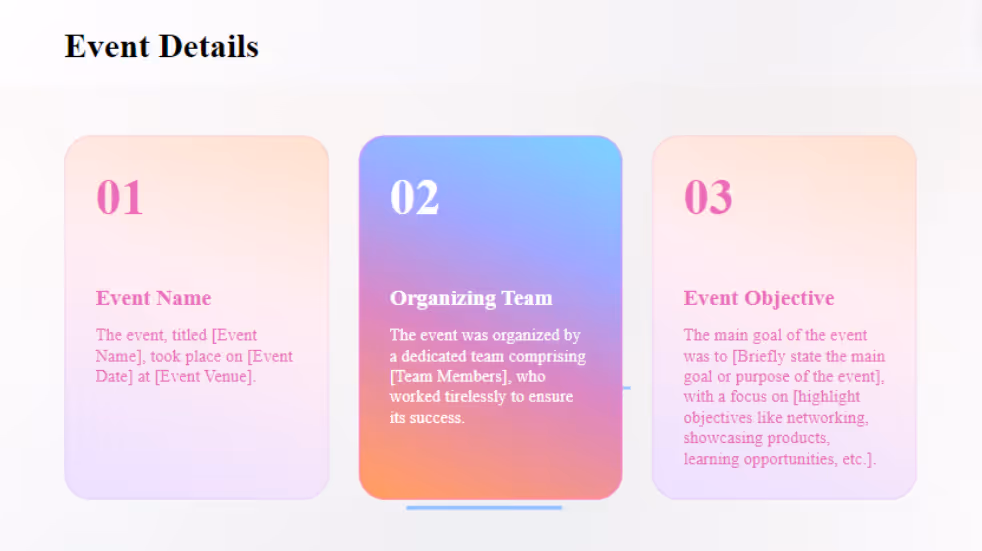
Post-Event Report: [Event Name]
Event Overview
Event Name: [Event Name]
Date: [Event Date]
Location: [Event Venue]
Organizing Team: [Team Members]
Event Objective: [Briefly state the main goal or purpose of the event]
Executive Summary
- This event gathered [number] attendees from [industries/fields].
- The main objectives included [highlight objectives like networking, showcasing products, learning opportunities, etc.].
- Key achievements include [briefly mention highlights].
- The event also faced challenges such as [highlight major issues, if any].
- The event received [X]% positive feedback, and attendee engagement was [Y]% above the expected rate.
Event Success Evaluation
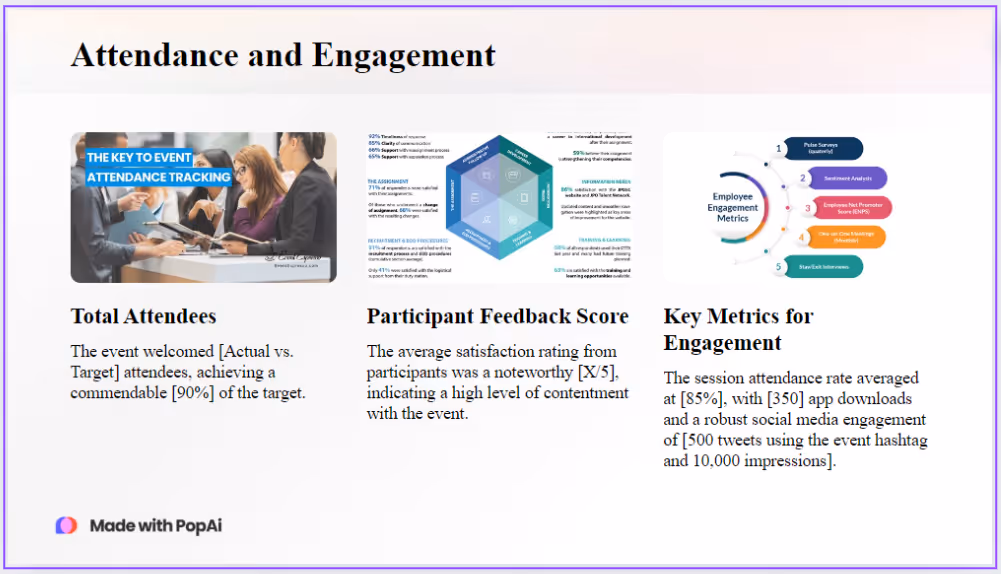
Attendance and Engagement
- Total Attendees: [Actual vs. Target]
- Example: Target: 500 | Actual: 450 (90%)
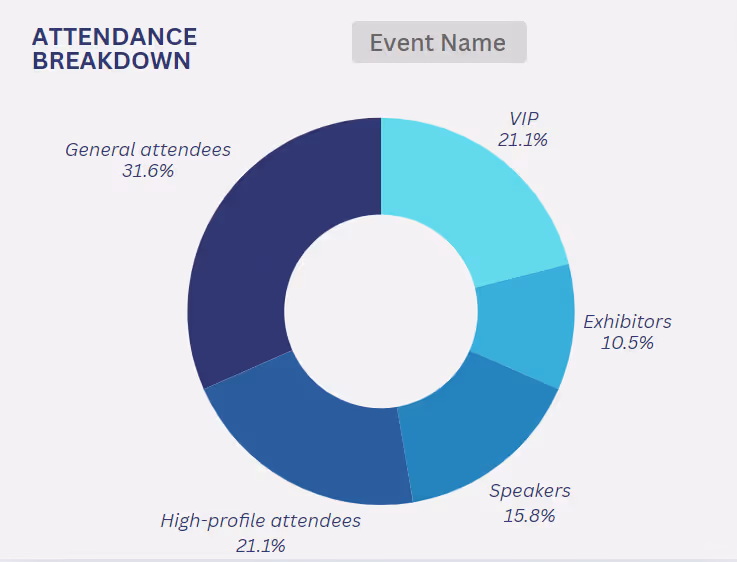
Chart 1: Attendance Breakdown
(Create a pie chart showing attendee types like general attendees, VIPs, exhibitors, and speakers)
- Participant Feedback Score:
- Average Satisfaction Rating: [X/5]
Chart 2: Participant Satisfaction
(Create a bar graph showing satisfaction ratings for different event aspects such as sessions, speakers, and venue)
Key Metrics for Engagement
- Session Attendance Rate: [Example: 85% average attendance across sessions]
- App Downloads: [Example: 350 app downloads]
- Social Media Engagement: [Example: 500 tweets using the event hashtag, 10,000 impressions]
Budget Analysis
- Total Budget: $[Amount]
- Total Revenue Generated: $[Amount]
- Net Profit: $[Amount]
Chart 3: Budget Breakdown
(Create a bar chart that breaks down expenditures such as venue, catering, staff, marketing, and technology)
- Main financial successes:
- Sponsorship revenue: $[X] exceeded the goal of $[Y].
- Challenges faced:
- Unplanned logistics costs exceeded the budget by $[X].
Marketing and Promotional Strategies
- Social Media Reach:
- Twitter: [X] mentions
- Instagram: [Y] posts
- Facebook: [Z] interactions
Chart 4: Social Media Reach
(Create a line chart showing daily/weekly impressions during the pre-event, event, and post-event phases)
- Paid Marketing Performance:
- Google Ads: 150 conversions at a cost-per-acquisition of $[X].
Stakeholder Feedback
- Sponsors’ Feedback:
- Sponsors were generally satisfied with branding opportunities, with 85% positive feedback.
- Exhibitors’ Feedback:
- 75% of exhibitors reported generating valuable leads during the event.
Lessons Learned
- Successes:
- The event successfully improved attendee engagement through interactive Q&A sessions.
- Areas for Improvement:
- Registration flow could be optimized by adding more check-in kiosks to reduce waiting times.
Actionable Insights for Future Events
- Increase self-check-in stations to reduce wait times by 20%.
- Enhance sponsor visibility with more branding opportunities across sessions and digital platforms.
- Continue leveraging social media for higher engagement and offer incentives for more user-generated content.
This post-event analysis highlights the successes of [Event Name] and provides key insights to make future events even more impactful. By focusing on areas like attendee engagement, budget optimization, and marketing improvements, we can drive even better results for upcoming events.
Event Reporting Examples in PPT and PDF Format

Tips for Effective Event Reporting
Effective event reporting delivers concise, insightful information that drives growth and improvement. Here's how to make your reports more impactful:
- Standardize your format: Create or use a consistent event reporting examples template for your reports to ensure easy comparison and seamless analysis across events.
- Focus on growth: Highlight key achievements and areas of improvement rather than diving into every small detail. Keep the focus on the big picture.
- Visualize data: Use graphs and charts to represent data like attendance, engagement, and ROI. This makes complex information easier to understand.
- Align with goals: Ensure your report ties back to the event’s original goals, providing clarity on whether those objectives were met or exceeded.
- Make it actionable: End with clear, actionable recommendations that can directly improve future events, ensuring the report serves as a tool for growth.
Resources for Event Reporting
A thorough post-event report requires the right tools and resources to ensure accuracy, efficiency, and insightful analysis. Whether you're tracking attendee data or measuring ROI, having access to the best resources will streamline the process and help you present your findings clearly. Here are some essential resources for effective event reporting:
- CRM Systems: Use platforms like HubSpot or Salesforce to track attendee data and engagement metrics in real time.
- Survey Tools: Leverage tools like Google Forms or SurveyMonkey to gather feedback from attendees, sponsors, and partners.
- Analytics Platforms: Use platforms like Google Analytics to track web traffic, conversions, and overall event engagement.
- Design Software: Tools like Canva or Microsoft PowerPoint are great for creating visually appealing and easy-to-read reports. They even have pre-made event reporting examples that you can use.
How can fielddrive Help?
fielddrive is a leading provider of onsite event technology that focuses on streamlining attendee check-ins, lead retrieval, and real-time data analytics. With tools designed to enhance the attendee experience and provide event organizers with actionable insights, fielddrive ensures that the data collected during the event translates seamlessly into comprehensive post-event reports. Here’s how fielddrive’s features can support post-event reporting:
- Facial Recognition Check-ins: Facial recognition technology speeds up and streamlines attendee check-ins. This feature provides real-time data on who attended, helping you capture accurate attendance numbers for your post-event analysis.
- Lead Retrieval Solutions: fielddrive’s lead retrieval tools allow exhibitors to capture and qualify high-quality leads. This data can be easily tracked and included in your post-event report, ensuring you measure the success of networking and engagement efforts.
- Real-Time Data Analytics: Track attendee participation, session attendance, and dwell time throughout the event. This live data can be instantly converted into insightful metrics that go straight into your post-event report.
- GDPR-Compliant Data Collection: Ensure your attendee data is securely stored and GDPR-compliant, making it easy to incorporate reliable information into your post-event reports without worrying about privacy issues.
By using fielddrive’s advanced technology, you can streamline the process of gathering accurate, real-time data and use it to create a robust post-event report that provides deep insights into the event’s success.
Conclusion
Creating a post-event report is essential for evaluating the success of your event and planning for the future. Gathering critical data—such as attendance numbers, lead retrieval metrics, and budget analysis—will provide a clear understanding of what worked well and where improvements are needed. A well-structured report offers actionable insights, helping you refine your strategies, enhance attendee engagement, and optimize ROI for future events.
For event planners looking to streamline the onsite event process, fielddrive is the perfect solution. With its real-time data analytics, facial recognition check-ins, and lead retrieval tools, fielddrive ensures that you capture critical event metrics with ease. This data not only simplifies post-event reporting but also provides valuable insights that drive future success.
Partner with fielddrive to transform your next event’s performance and reporting. Book a free demo today!
.svg)
.svg)
.svg)
Want to learn how fielddrive can help you elevate your events?
Book a call with our experts today

.svg)